- Home
- Products
- Well Data Lifecycle
- SiteView
- Data Analysis
SITEVIEW DATA ANALYSIS
SiteView provides many tools for you to analyze your data, including the following:
- Reports (single and multi well)
- Visualizers such as the site schematic
- Export to Excel templates
REPORTS
SiteView is equipped with a wide range of standard reports for construction, facility equipment, facility operations, EH & S, and site operations data management. In addition to our prepared output, you can do the following:
- Customize SiteView reports to meet specific needs and easily share report templates between users
- Create ad hoc reports as needed
- Access the data editor directly from the report
- Report for single sites or multiple sites
- Include SiteView calculations in your templates (1000s of calculated values/KPIs are available)
- Incorporate ‘drawn from data’ graphs and schematics in reports to further visualize data
- Add images from attachments, such as photos of equipment
- Create an Excel template directly to use such features as pivot tables and graphs
SCHEMATIC
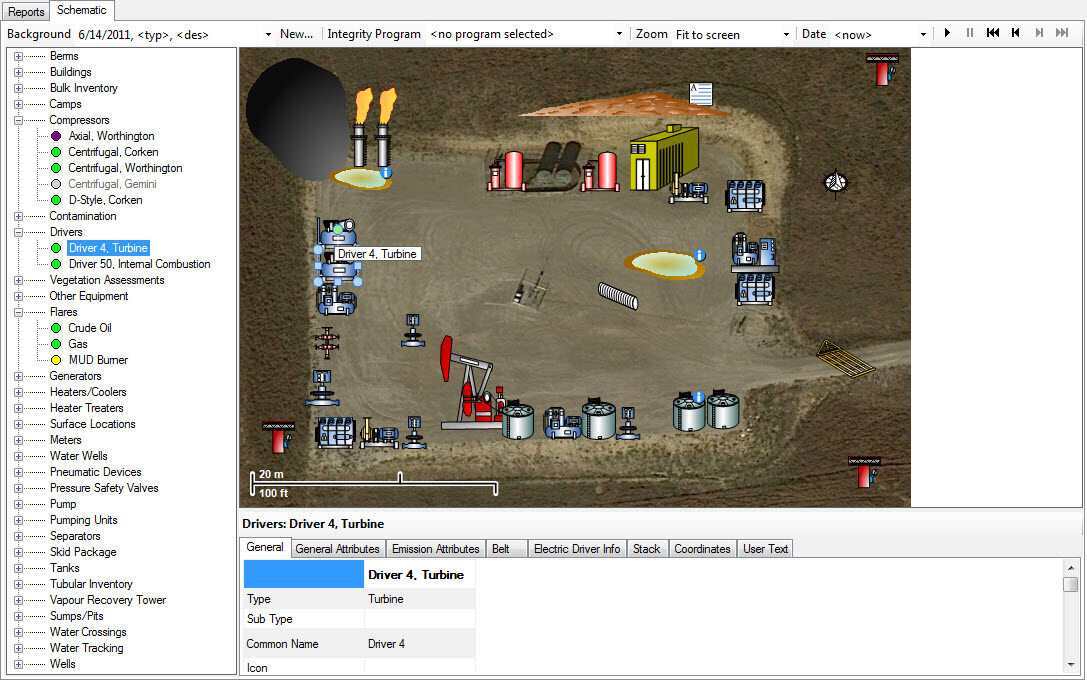
The SiteView schematic tool shows the data entered in the site file by date on a geospatially tagged image, which is a photograph or other image that has had geographic information added to it, including the latitude and longitude coordinates of the location.
The site schematic can provide a visual history of your site file as the physical components on location change over time.
The geospatially tagged image appears as a background in the schematic. You can assign icons to equipment on your site, and the icons appear on the schematic. When you drag icons onto the image, the GPS latitude and longitude values are assigned to the icon and corresponding data record.
EXCEL AND 3RD PARTY ANALYSIS
The report engine in SiteView allows you to pass data to Excel templates within the application, allowing users to leverage Excel for analysis (using pivot tables, graphs, math functions, etc.).
It is possible to connect 3rd party visualizers to the SiteView database. For optimal performance, access to calculated values and units of choice connect the analysis tool to the MasterView Data Warehouse.
** © Peloton Computer Enterprises Ltd. All rights reserved. WellView, SiteView, RigView, ProdView, LandView and MasterView are registered
trademarks of Peloton Computer Enterprises Ltd. All other trademarks and registered trademarks are owned by their respective companies.
Advantages
SiteView is an efficient easy-to-use solution that empowers your staff to collect, analyze, monitor and report information, while drastically reducing your costs of implementation and IT support.
Interface
SiteView has a broad application, from surface information such as permitting, construction, reclamation and remediation through full facilities including pipeline asset tracking and management.
Integration
The Peloton Platform allows integration between WellView, SiteView, RigView, ProdView, and LandView. Peloton uses an open database architecture, so integration into your other systems and workflows can be easily facilitated.
Schematic
The SiteView site schematic uses a Geospatially tagged image as the background. You can assign icons to various types of equipment within your site, and the icons appear on the schematic, allowing you to view the site schematic and its components as they change over time.
Services & Support
Get the most out of your Peloton solutions with our well-executed services. Whether you’re in the midst of a new software implementation, or have used our software for the past 10 years, our team of technical experts will increase the value of your Peloton investment.
Upcoming Webinars
Check out the listing of all the upcoming Peloton Webinars on a wide variety of products! Topics range from intro knowledge of products to highly in-depth discussions centered around product-specific workflows.
We Are Here For You, Wherever You Are
Reach out to one of our twelve offices around the globe to access immediate support, to get information, or to speak with our international helpdesk.


